

SUM: Gain an overview of income, stock levels and expenses on your product groups, ABC categories or suppliers
The new tab “SUM” is a part of the December feature release 2014 and enables you to create a view, columns by column. You decide which columns to add, and which values to compare.
Look and feel
The new tab “SUM” resembles an advanced cross table. You can display number-columns as actual values or percentage, with or without decimals. Below you see the SUM tab, displaying product groups (left), sorted by turnover.
A single product group accounts for a significant part of your turn over: Product group 3 accounts for 25 % (upper line, dark blue arrow)
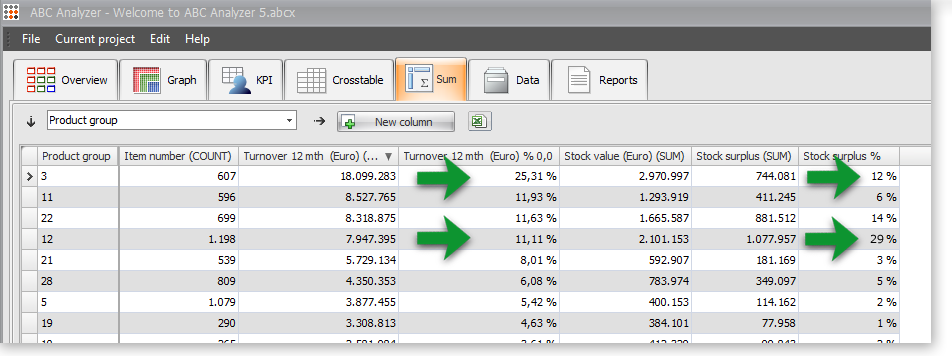 A closer look on product group 3 (upper line) reveals a high stock value, but “stock surplus, in percentage” isn’t alarmingly high.
Further down you spot a product group which accounts for 29 % of your stock surplus, but only 11 % of your income. At this moment that’s equivalent to more than 1 mill € in stock surplus, and it might be worth a while investigating if a stock level this high is needed.
How to setup a SUM view – and edit it
At the image above: Choose a text-column in the first drop down, e.g. product group
Press the “Add column”-button, and you’ll get this pop up.
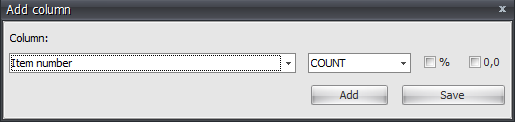
Choose a number-column, and use the two check boxes to specify whether you want it displayed as percentage and/or with decimals.
Two buttons:
- Add: Add one or more columns
- Save: Close pop-up and calculate the new view
Once you’re done setting up columns ABC Analyzer begins calculating your view.
Edit or delete a column
Right-click a column to edit it, or delete it. Click and “pull” the headline of a column to move it.
Add more columns
You can always add more columns to your view, by using the “add column”-button.